|
|
Regul@tionSpotterDocumentation |
| Documentation |
| Input | Synopsis | Filter options | Project management | Output | single variant documentation | Contact |
| Examples |
| Examples & Tutorial |
VCF file
The gateway to RegulationSpotter is our Query Engine. Here, you can upload any standard VCF 4.1 file for analysis with RegulationSpotter. Note that the chromosomal positions have to relate to GRCh37. Please also note that asterisks (*) standing for a deleted allele in VCF 4.2 are currently not analysed. For a tutorial on how to use the Query engine please click here. In our QueryEngine interface, you can determine the following properties:Homozygous Only
Tick this box if you want to only consider homozygous variants in your analysis.
Filter polymorphisms
Enter a threshold for discarding variants as polymorphisms using the frequency observed in 1000G and ExAC. The default filtering is 4 for homozygous in 1000G and 10 for homozygous in ExAC. It is also possible to filter for variants present in any form (heterozygous and homozygous) as defined in the second row in case of non-recessive traits. Set both values to zero if you do not wish any filtering. All values refer to the number of individuals with the specific allele setup.
Minimum Coverage
Enter the minimum value for your variant's coverage. The default is 4.
Analyse the following regions or genes
Select whether you wish to analyse the entire VCF file, or custom regions or genes. This can also be done after analysing the complete vcf file upon restricting the display of analysis results to variants residing in certain candidate genes or regions. There is no difference between the two filter options regarding the output. However, speed of the analysis is usually increased if the restriction to certain genes / regions is already selected ahead of the analysis. On the other hand, users are free to select / deselect different gene panels after the analysis if they initially do not exclude any variants.
A page similiar to this page will appear after RegulationSpotter is done with its analysis. You can navigate to a synopsis of your analysis here as well as filter and sort your results.
Project ID
The project ID allocated by RegulationSpotter. It is used in the URL to enter your project results. If you wish to easily access your results later on, you can note the URL and the project ID. Please do not delete or alter the project ID in the text field on the results page.
Synopsis
A synopsis of submitted and analysed variants can be shown on demand by clicking on the show / hide statistics link at the top and bottom of the page. Most often, RegulationSpotter will not analyse each and every line of your VCF file, either because you have set certain filters, or because certain variants were not suitable for analysis with RegulationSpotter. The synopsis gives you an idea of how your analysis went.Submitted Variants
Number of alterations (lines) in VCF file.
Discarded before analysis
Number of variants which were filtered out according to user input (below coverage, not homozygous, out of specified region / chromosome) or due to input / format errors (e.g. variant equals refseq, reference allele equals alternative allele, Indel is too long or neither genotype nor frequency are supplied).
intratranscriptic variants (MT +RS)
Variants localised in a protein-coding transcript, which were analysed with MutationTaster for evaluation of effects on the protein, as well as by RegulationSpotter, to account for possible regulatory impact of intratranscriptic variants.
MutationTaster analyses (variant/transcript pairs)
The lines following this subheading give information about different types of variants and predictions made by MutationTaster. The sum of all predictions made by MutationTaster are usually significantly more than the analysable variants, because for most variants more than one (suitable) transcript will be found.
Type
The type of prediction algorithm used by MutationTaster. without_aae: our algorithm for silent alterations. simple_aae: our algorithm for simple amino acid exchanges (one amino acid exchanged by another). complex_aae: the algorithm for amino acid exchanges involving more than a simple exchange of one residue.
Prediction
Gives an overview of the predictions generated by MutationTaster. The four options are:
More information on the classifications can be found in MutationTaster's documentation.
Regulation Spotter only / extratranscriptic variant (RS only)
Number of variants which are located outside of protein-coding transcripts and analysed exclusively by RegulationSpotter. Please note: The sum of intratranscriptic variants plus extratranscriptic variants is not necessarily identical to the number of all variants minus the discarded alleles because one line in the vcf file can contain more than one alternative allele which are all individually counted if discarded.
Filter and display options
To make your analyses as convenient as possible, RegulationSpotter offers great flexibility in the results display. Select whether you wish to display variants from the entire VCF file, or custom regions or genes. The restriction to candidate regions or genes can also be done before analysing the complete vcf file. There is no difference between the two filter options regarding the output. However, analysis is usually speed up if the restriction to certain genes is chosen already ahead of analysis. On the other hand, users are free to select / deselect different gene panels after the analysis if they initially do not exclude any variants. After analysis, it is also possible to select candidate genes by entering symptoms or diseases from the HPO, OMIM or OrphaNet. Afterwards, RegulationSpotter will automatically suggest candidate genes associated with the entered symptoms / diseases.Phenotype
You can enter diseases or symoptoms relevant for the case that you are analysing. As soon as you are typing, autocompletion will suggest relevant terms / entries from the HPO, OMIM and Orphanet. Tick the diseases and symptoms of your choice. Then hit the "find suitable genes" button and RegulationSpotter will automatically suggest candidate genes which are known to be associated with the selected diseases or symptoms. A cut-off for gene search can be adjusted. The default is 70%; lowering this value will result in the suggestion of more candidate genes (and more noise), increasing this value will lead to the suggestion of fewer, but highly relevant candidate genes.
Candidate genes
If you enter candidate genes in this text area, RegulationSpotter will only display the analysis results for variants localised within the chose candidate genes or their regulatory regions (including distant enhancers,) given they are annotated).Candidate regions
If you enter candidate regions in this text area, RegulationSpotter will only display the analysis results for variants localised within these regions.Variant selection
Choose if you want to display all analyses made by RegulationSpotter and MutationTaster, or only a selection. The default setting is the display of analysis results from both tools.
Hide unlikely variants
Choose if you want to prevent certain variants from being displayed, beause they are at least in the first place rather unlikely to be involved in the onset of disease.
Sort by
This section allows you to sort your results by various properties. By default, they are displayed by effect first, followed by position and effect.
Finally, just click on the big 'display' button to get a look at your results.Project management
Chr, Pos, Ref, Alt
Information on the location and nature of the alteration.
(known) variant effect
Known or likely effect of the alteration. Depending on whether the variant is considered to be intragenic or extragenic (extratranscriptic), the options are:
Intragenic variants analysed by MutationTaster
More information on the classifications can be found in MutationTaster's documentation.
Extratranscriptic variants analysed by RegulationSpotter
Variant Frequency
Information on the availability of the variant in genetic frequency databases (dbSNP, 1000G)
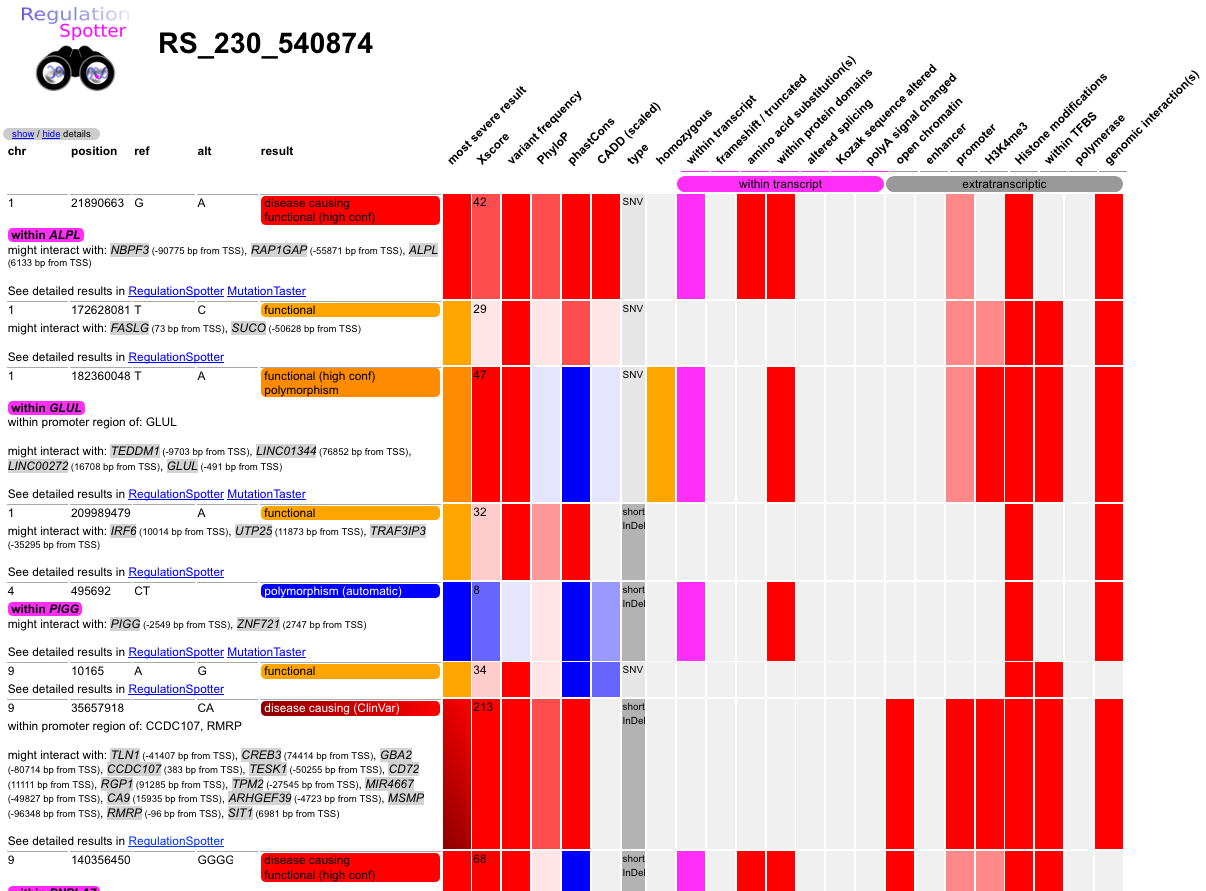
Results table - colour-coded matrix
The second part of the results table is displayed in a colour-coded matrix. For various properties, each column gives an indication on the severity of the alteration and on its likelihood to be located in a regulatory region. Less transparency signifies a higher indication for a regulatory function/functional impact.Most Severe Result
Most severe RegulationSpotter result for all available transcripts, will be used for sorting.
Region Score
RegulationSpotter score for the variant's location. The score integrates all found evidence for the functionality of the variant. Higher values indicate a higher probability of functionality.
Type
Type of alteration: Single nucleotide variant (SNV), Insertion/Deletion (InDel). InDels can be long (>10 bp) or short.
Intragenic Variant
Indicates whether the variant is located within a gene.
NMD / PTC / frameshift /truncated
Indicates whether the variant is a highly deleterious one, e.g. leading to nonsense-mediated decay (NMD), premature termination codon (PTC), frameshift or truncation
Amino Acid Substitution(s)
Displays whether an amino acid exchange occurs.
Within Protein Domains
Indicates whether the variant is located within a protein domain.
Altered Splicing
Indicates whether the variant leads to the alteration of a splice site.
Kozak Sequence Altered
Indicates whether the variant leads to the alteration of a Kozak sequence.
PolyA Signal Changed
Indicates whether the variant leads to the alteration of a poly-A signal.
miRNA Binding Site
Indicates whether the variant leads to the alteration of a miRNA binding site.
Open Chromatin
Indicates whether the variant is located within an open chromatin section.
Enhancer
Indicates whether an enhancer is annotated for the variant.
Promoter
Indicates whether the variant is located within a promoter. Active signifies that in addition, H3K4me3 and DHS annotations are also available for the site (please refer to our detailed page documentation for more information)
H3K4me3
Indicates whether the variant is located within a H3K4me3 positive region indicative for active transcription. Robust indicates that these annotations were available for at least three different cell lines.
Histone Modifications
Histone modification annotations from Ensembl at the site of interest.
Within TFBS
Indicates whether the variant is located within a transcription factor binding site (TFBS) from Ensembl [2].
Polymerase
Polymerase II and III binding sites annotated for the region.
Genomic Interaction(s)
Indicates whether the variant is located within a genomic interaction site according to Rao et al [1]
PhyloP /PhastCons (max)
Indicates the highest PhyloP [3] and PhastCons [4] scores, respectively.
CADD (Scaled)
Indicates the scaled CADD score for the alteration.
Variant Frequency
Variant frequency in dbSNP and 1000G. Unknown/rare alleles are marked with a bright red colour.